Tucson, Arizona - Sensor Web 3.2
We have partnered with the
University of Arizona and
Tucson Water to
broaden the use of Sensor Web technology in environmental research
and to develop the macro-intelligence capabilities of the system.
In this case, the Sensor Web is being used to aid in the study
flooding.
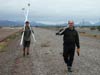
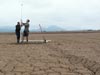
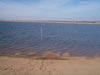
This Sensor Web is deployed at the Central Avra Valley Storage and
Recovery Project
(CAVSARP)
facility located west of Tucson, AZ. This particular site was
selected because it is ideal for studying spatio-temporal phenomena
and for providing a test site for more sophisticated hydrological
studies, including that of comparing the data from the Sensor Web
to remote measurements taken from orbiting satellites.
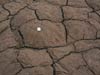
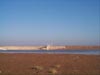
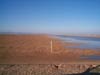
The facility provides controlled conditions of soil moisture, from
dry (very low moisture) to inundation (soaked). The recharge
basins can be flooded with water (up to about 8 feet) and drained
at will. This provides a means to use the Sensor Web to track the
moving flood front, as well as to follow the penetration of the
water into the ground.
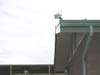
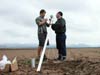
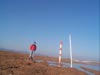
The Sensor Web was deployed and activated on November 13, 2003 and
consists of 16 pods equipped with sensors for ambient air
temperature, relative humidity, and light level. In addition, the
Sensor Web pods inside the recharge basin are equipped with a soil
temperature sensor (at surface level) and two soil moisture sensors,
one buried just below the surface and the second buried at a depth
of 0.5 m. These soil sensors are attached to the pods via long
leads, which allows the pods to stay above water during flood
events. (While the pods themselves are water-tight, pod-to-pod radio
communication would not be possible if they were submerged.) The
deployment topology was determined by the scientific nature of the
study and not limited by technology considerations such as radio range.
Flooding events within the recharge basin can be observed real-time
via soil moisture sensor 1 (at the surface) and 2 (buried 0.5 m
below) on various pods. The lower the resistance measured from the
sensor, the wetter the soil. During controlled flooding events, for
example, it is possible to watch the water spread both laterally
across the basin from the inlet point in the northwest corner, as
well as infiltrate into the ground. Drainage shows the opposite
pattern with the south side of the basin drying out first. This
can be compared to a rain event, where all the surface soil moisture
measurements show increased wetness at approximately the same time.
This Sensor Web ran unattended continuously for 17 months, finally
being decommissioned in April 2005. This Sensor Web system not
only proved the robustness of the design in a remote, hot
environment but also provided insights on the use of Sensor Web
technology for Earth Science applications. More details of this
research can be found
here.
See an aerial map
of the pod locations.