Huntington Botanical Gardens - Sensor Web 5.0
Our collaboration with the
Huntington Botanical Gardens continues with the next generation
Sensor Web.
After a successful 2.5 year run, Sensor Web 3.1 was replaced by
Sensor Web 5.0 in June 2005. This new generation of Sensor Web
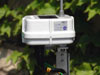
represents a major step forward with both the internal electronics
and external packaging being re-designed from the ground-up, using
the lessons learned from previous deployments. For example, power
management has improved and therefore only one solar panel is now
required to keep the batteries charged.
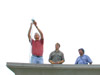
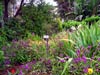
The deployment of Sensor Web 5.0 is predicated on using the system
to learn about botanical conditions in an urban environment.
Working with Garden Director Jim Folsom, we have deployed the
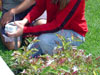
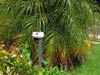
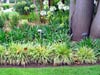
Sensor Web along lines that run roughly north-south. Strategic
positioning of Sensor Web pods along building faces, hedges, and
within dense flora will help illuminate the microclimate conditions
seen by the plants as they grow.
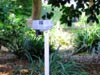
Each Sensor Web pod measures light levels, air temperature, and
humidity. Most pods also measure the soil temperature and soil
moisture as two depths: sensor set 1 measures at 3 inches down,
just below surface level, while sensor set 2 measures 12 inches
down. In addition, the pods also measure battery level, local tilt,
and internal temperature which are useful quantities for diagnostic
purposes. Measurements are taken synchronously across the Sensor
Web every 5 minutes.
The diverse suite of sensors allows for all kinds of complex
environmental patterns to emerge, both locally around each pod
and globally over the entire Sensor Web. Notice, for example, the
correlation between local temperature, humidity, and soil moisture
during watering or rainstorms.
Sensor Web 5.0 also employs a new graphical user interface with
three separate views: temporal, spatial, and icon. The temporal
view is the strip-chart recorder-like display familiar from
previous deployments. The spatial view is a dynamic map showing
both the position of an individual pod within the Sensor Web as
well as a particular measurement. To view the precise values of
these measurements, place the mouse pointer over the pod marker on
the map; the value will appear in the upper right corner of the
window. Notice that the color of the pod marker is an indication
of the measurement status: from the safe area of green to the
extrema of red. The icon view similarly uses colors as an
indication of pod status for a variety of measured parameters
and can be used to monitor many Sensor Web pods simultaneously.
Again, placing the mouse pointer over the traffic light pops up
the measurement value.
See a map [high-resolution, low-resolution]
of the pod locations.